Introduction:
The Google Sheets Query function is an incredibly powerful tool for managing and analysing data within your spreadsheets. It allows you to use SQL-like syntax to manipulate data, making complex tasks easier and more efficient. This tutorial will guide you through the basics of using the Query function, helping you harness its full potential.
What is the Google Sheets Query Function?
The Query function in Google Sheets is used to fetch specific data from your spreadsheet based on criteria you define. It can perform a variety of operations such as filtering, sorting, and aggregating data, much like SQL does in a database. For businesses using Requisite Reporting, this function can be integrated into daily workflows, saving time by automating data retrieval and analysis.
Basic Syntax
The basic syntax for the Query function is:
‘data’: The range of cells you want to query.
‘query’: The SQL-like query string that defines the operations to perform.
[headers]: (Optional) The number of header rows in the dataset.
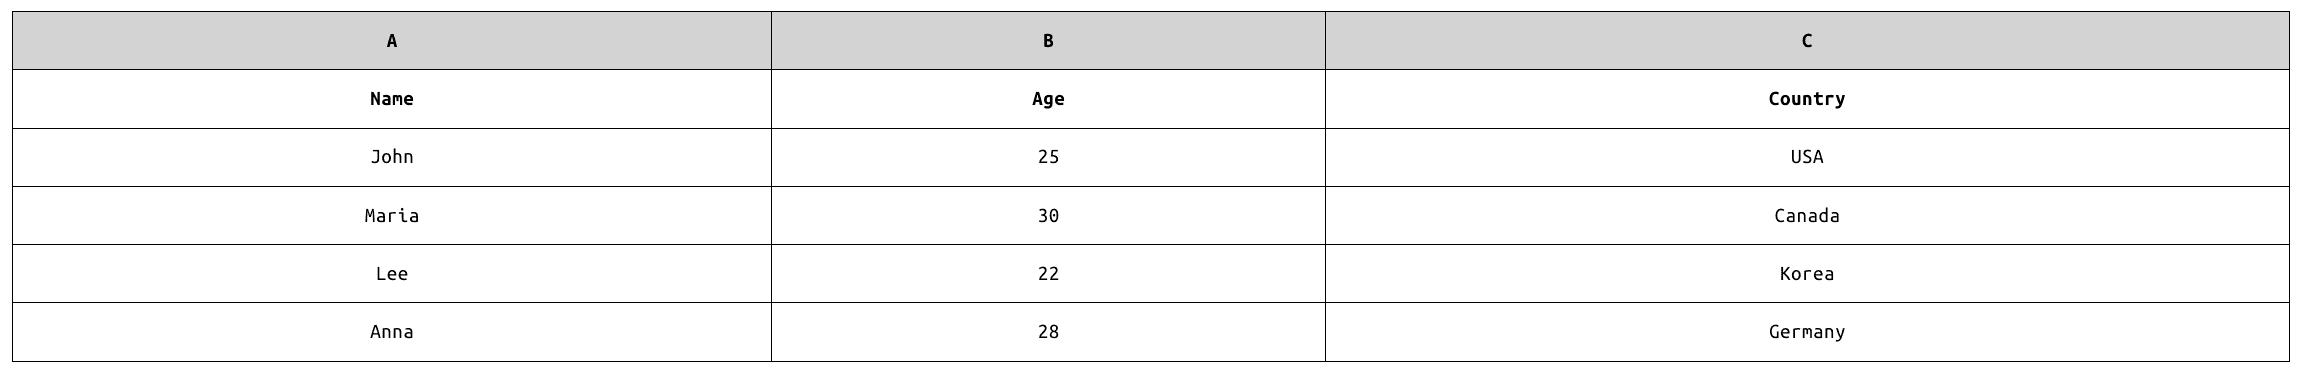
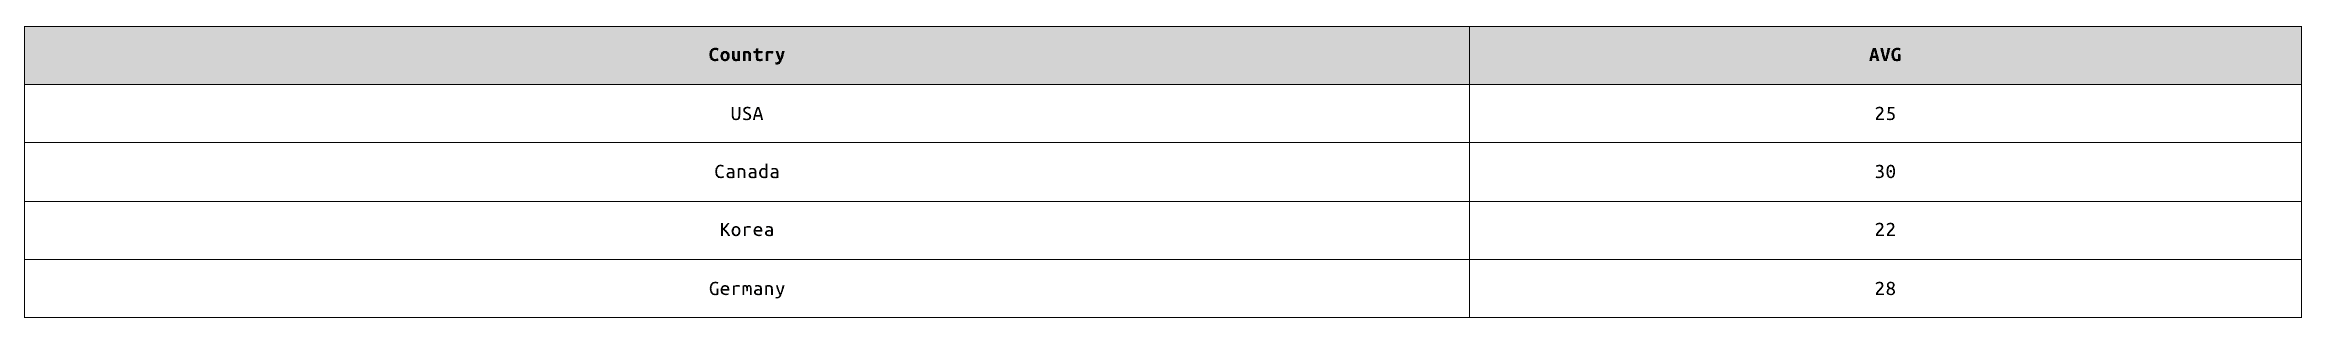
Example Data Set
Let’s consider a simple dataset:
Basic Queries
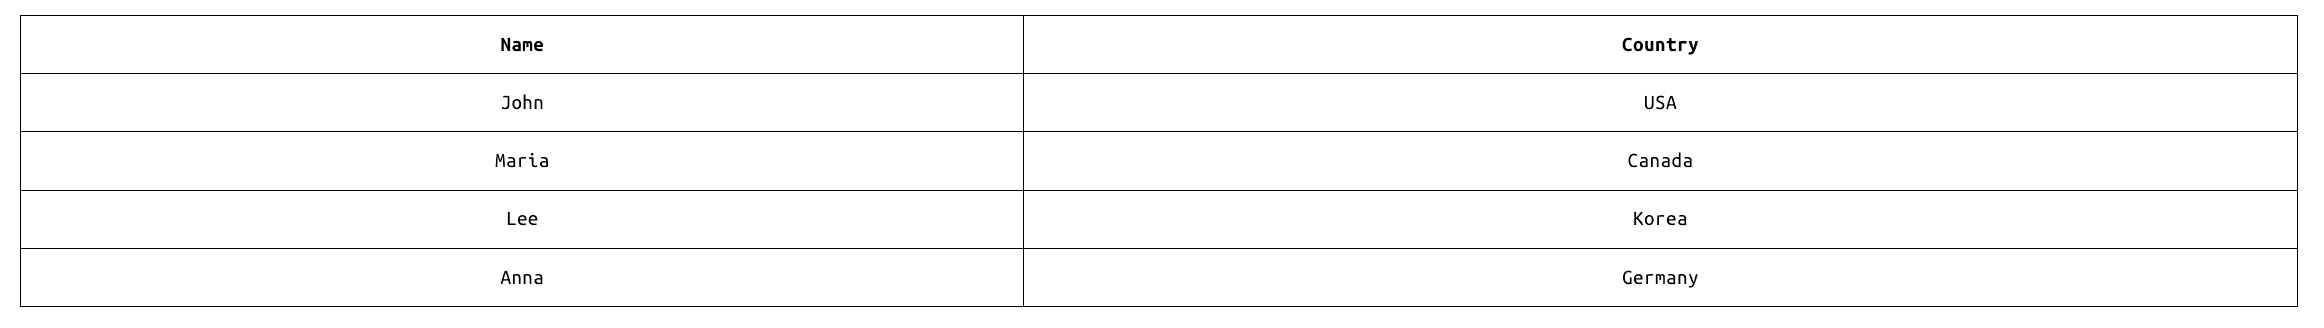
Selecting Columns
To select specific columns, use the SELECT statement:
This will return:
Filtering Rows
To filter rows, use the WHERE clause:
This will return:

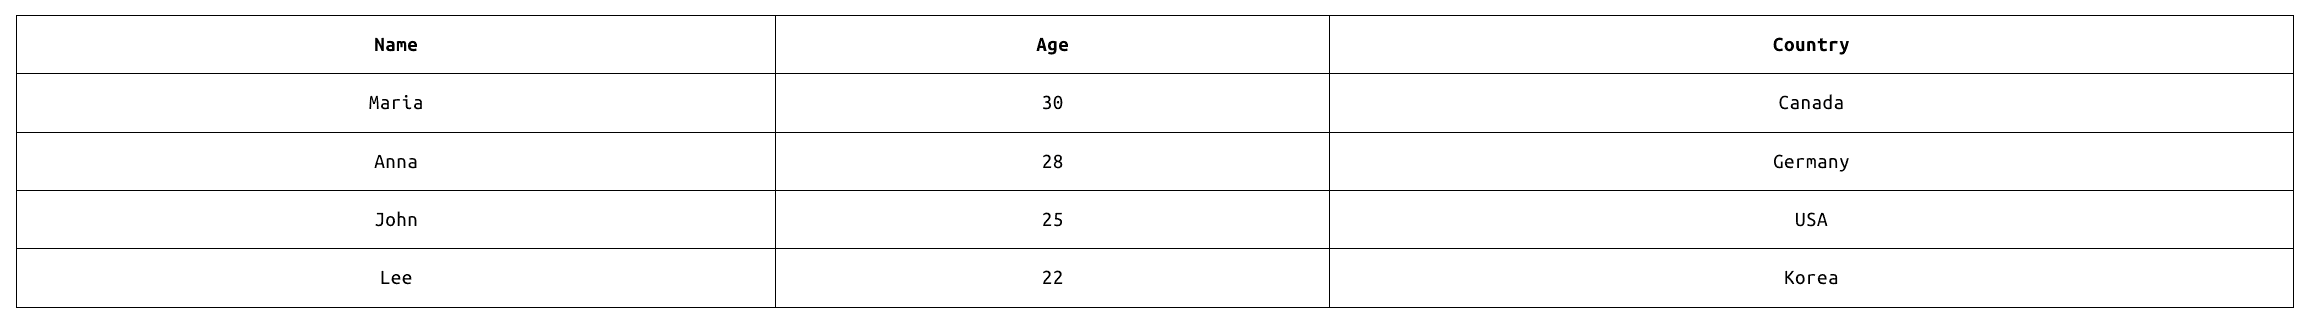
Sorting Data
To sort data, use the ORDER BY clause:
This will return:
Advanced Queries
Aggregating Data
To perform aggregation, such as summing or averaging, use the GROUP BY and aggregation functions:
This will return:
Combining Multiple Conditions
To combine multiple conditions, use AND or OR:
This will return:

Practical Applications
The Query function can be used for various practical applications, such as:
Data Cleaning: Filter out unwanted data.
Reporting: Generate summary reports.
Dashboards: Create dynamic data visualisations.
——————————————————————
Saving Time With Requisite Reporting
For eCommerce brands, time is money.
Manually entering data into Google Sheets can take up valuable hours every day.
Requisite Reporting offers a solution by automating data integration from various sources. Instead of spending time manually inputting data, brands can access their data seamlessly through Requisite Reporting’s pre-configured dashboards, saving over two hours daily.
This not only streamlines operations but also allows for more strategic use of time.
——————————————————————
Conclusion
The Google Sheets Query function is a versatile tool that can simplify your data manipulation tasks. By mastering its syntax and capabilities, you can transform how you work with data in Google Sheets. Additionally, leveraging tools like Requisite Reporting can further enhance your efficiency by automating data integration, allowing you to focus on analysis and strategy rather than manual data entry. Start experimenting with basic queries and gradually explore more advanced features to unlock the full potential of this powerful function.
——————————————————————
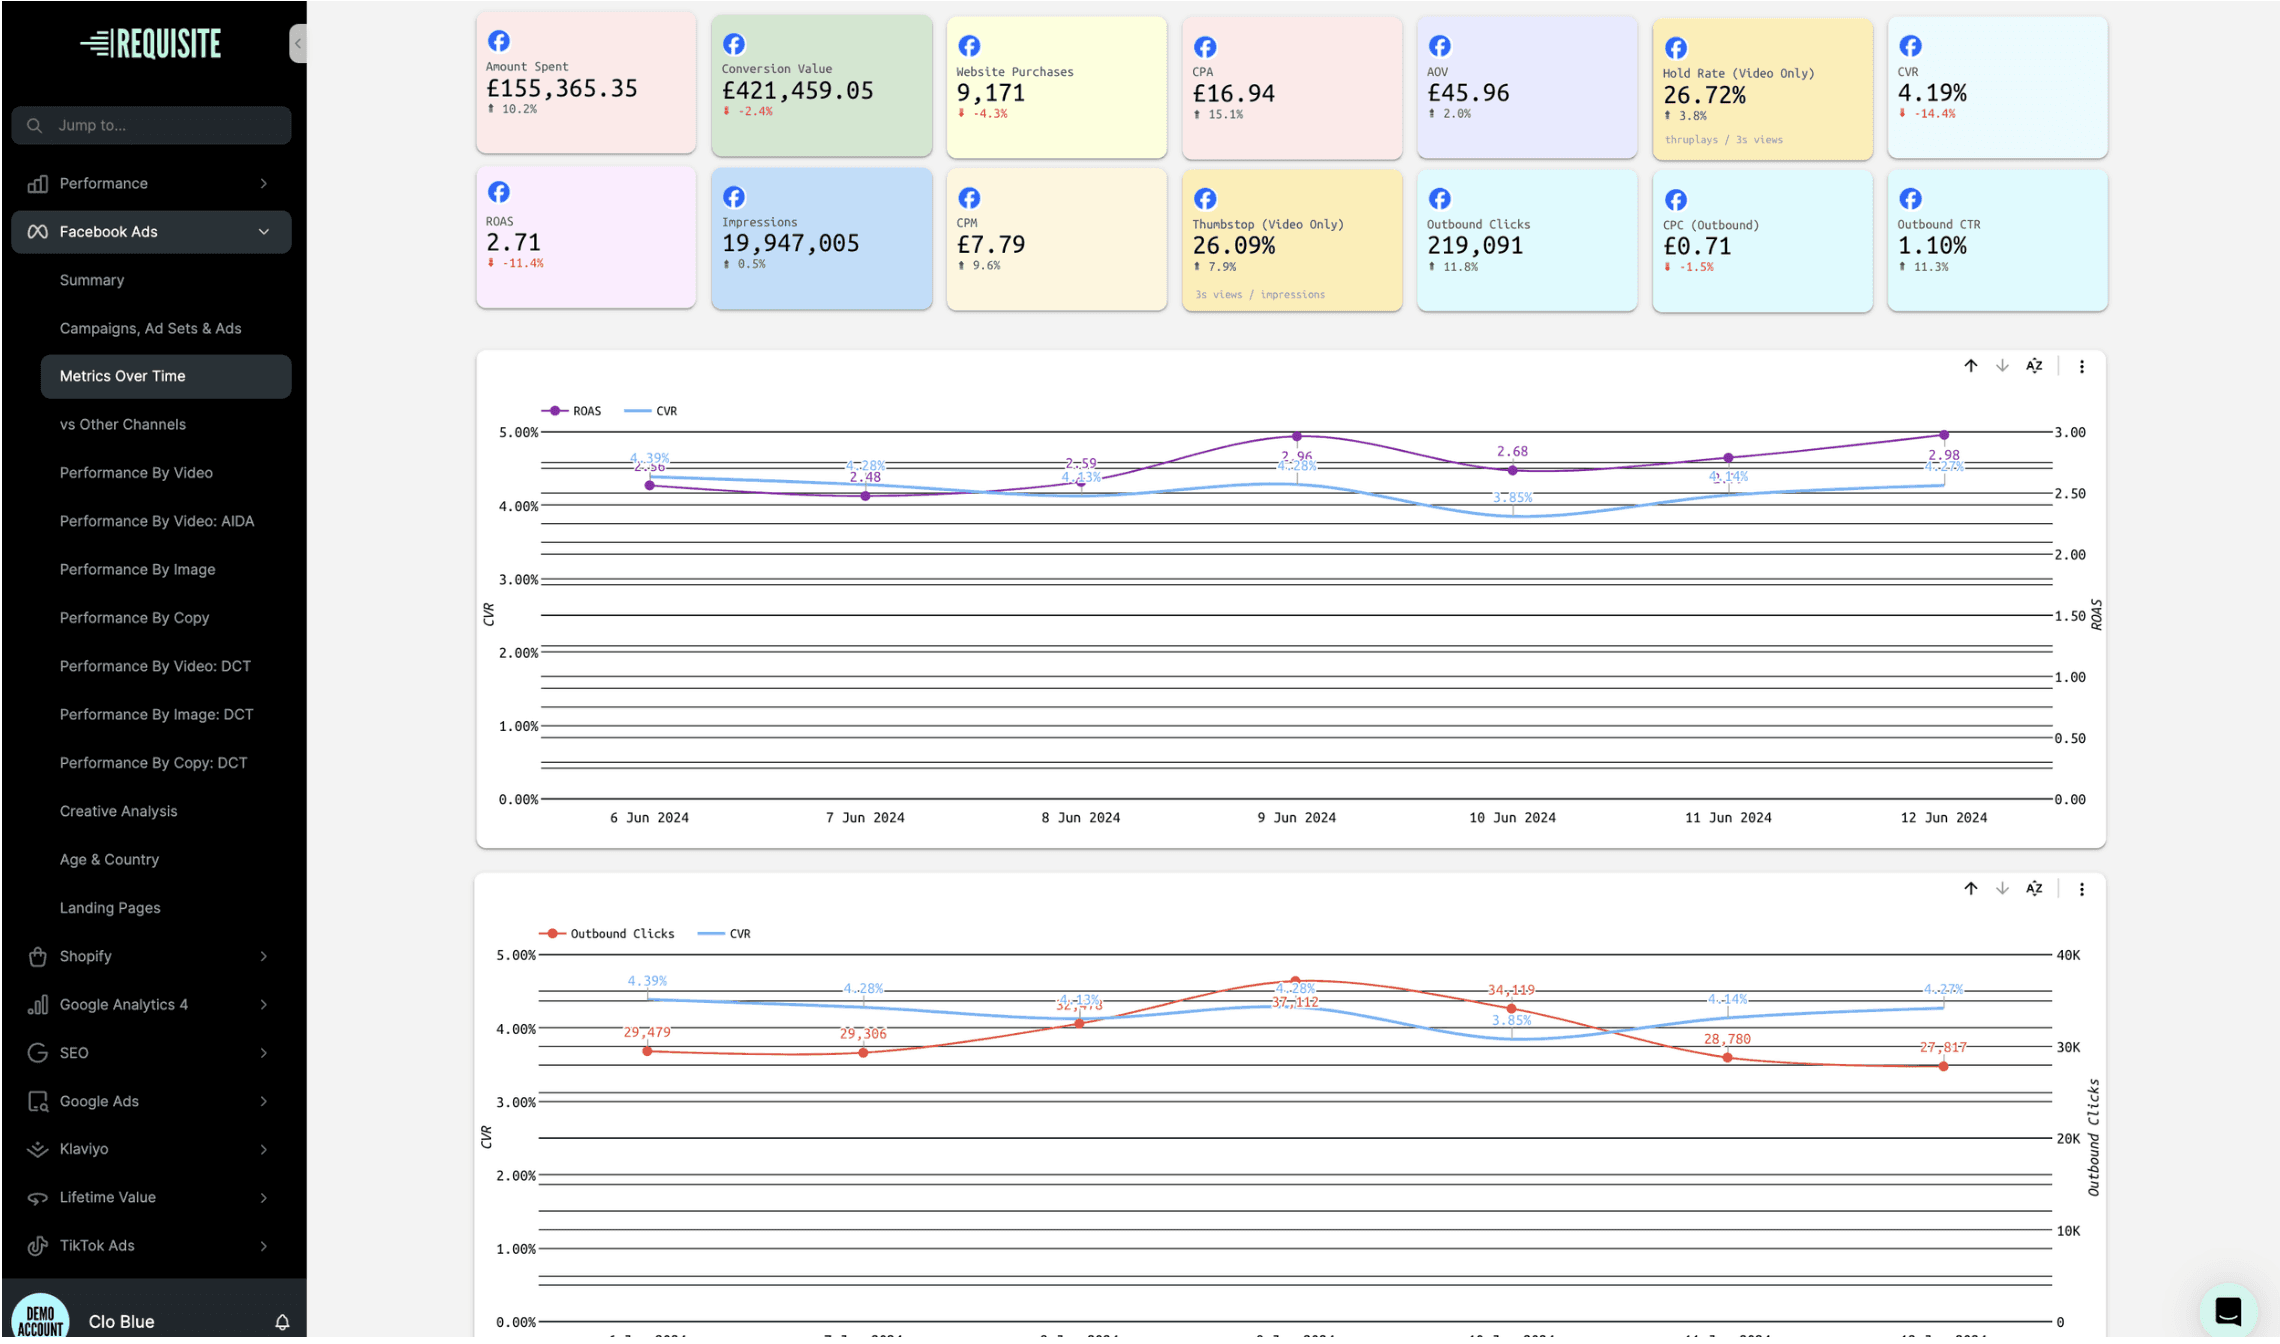
Requisite Reporting offers a comprehensive solution for eCommerce brands, providing over 100 pre-configured dashboards and 600+ connectors to various data sources. The platform centralises data, allowing businesses to analyse performance across multiple channels in one place. Key features that support data analysis include:
Detailed Reports: Colour-coded reports provide clear insights into key metrics, making it easy to identify trends and areas for improvement.
Custom Views: We customise every page of every report to ensure that relevant data is accessible and actionable.
Quick Setup: Requisite Reporting promises setup within 24 hours, enabling businesses to start analysing data quickly and efficiently.
Article by

Clo Blue
CEO and Founder
Published on
Jun 14, 2024