Introduction:
In the competitive world of eCommerce, data-driven decision-making is no longer a luxury but a necessity. With vast amounts of data generated from various marketing channels, including Facebook Ads, Google Ads, and Shopify, understanding how to analyse and leverage this information can significantly enhance marketing strategies. This essay explores the importance of eCommerce data analysis and provides actionable insights on how businesses, including those using platforms like Requisite Reporting, can harness data to drive better marketing outcomes.
The Importance of eCommerce Data Analysis
eCommerce data analysis involves examining data collected from various sources to understand consumer behaviour, track performance metrics, and optimise marketing efforts. This analysis is crucial for several reasons:
Enhanced Customer Understanding: Data provides insights into customer preferences, purchasing behaviour, and demographics, allowing businesses to tailor their marketing strategies to meet customer needs better.
Optimised Marketing Spend: By analysing data, businesses can identify which marketing channels are most effective, ensuring that marketing budgets are allocated to the strategies that yield the highest return on investment (ROI).
Improved Decision-Making: Data-driven insights enable businesses to make informed decisions, reducing the reliance on guesswork and intuition.
Personalisation: Understanding customer data allows businesses to personalise marketing messages, improving customer engagement and conversion rates.
Key Metrics in eCommerce Data Analysis
To effectively analyse eCommerce data, it is essential to focus on key performance indicators (KPIs) that provide valuable insights into marketing performance. Some of the most critical KPIs include:
Conversion Rate: The percentage of visitors who complete a desired action, such as making a purchase. This metric is crucial for understanding the effectiveness of marketing strategies.
Customer Acquisition Cost (CAC): The cost of acquiring a new customer. Lowering CAC while maintaining or increasing conversion rates is a sign of effective marketing.
Average Order Value (AOV): The average amount spent by customers per transaction. Increasing AOV can significantly boost revenue.
Customer Lifetime Value (CLTV): The total revenue a business can expect from a customer over their lifetime. A high CLTV indicates strong customer loyalty and effective retention strategies.
Return on Ad Spend (ROAS): The revenue generated for every dollar spent on advertising. This metric helps assess the efficiency of advertising campaigns.
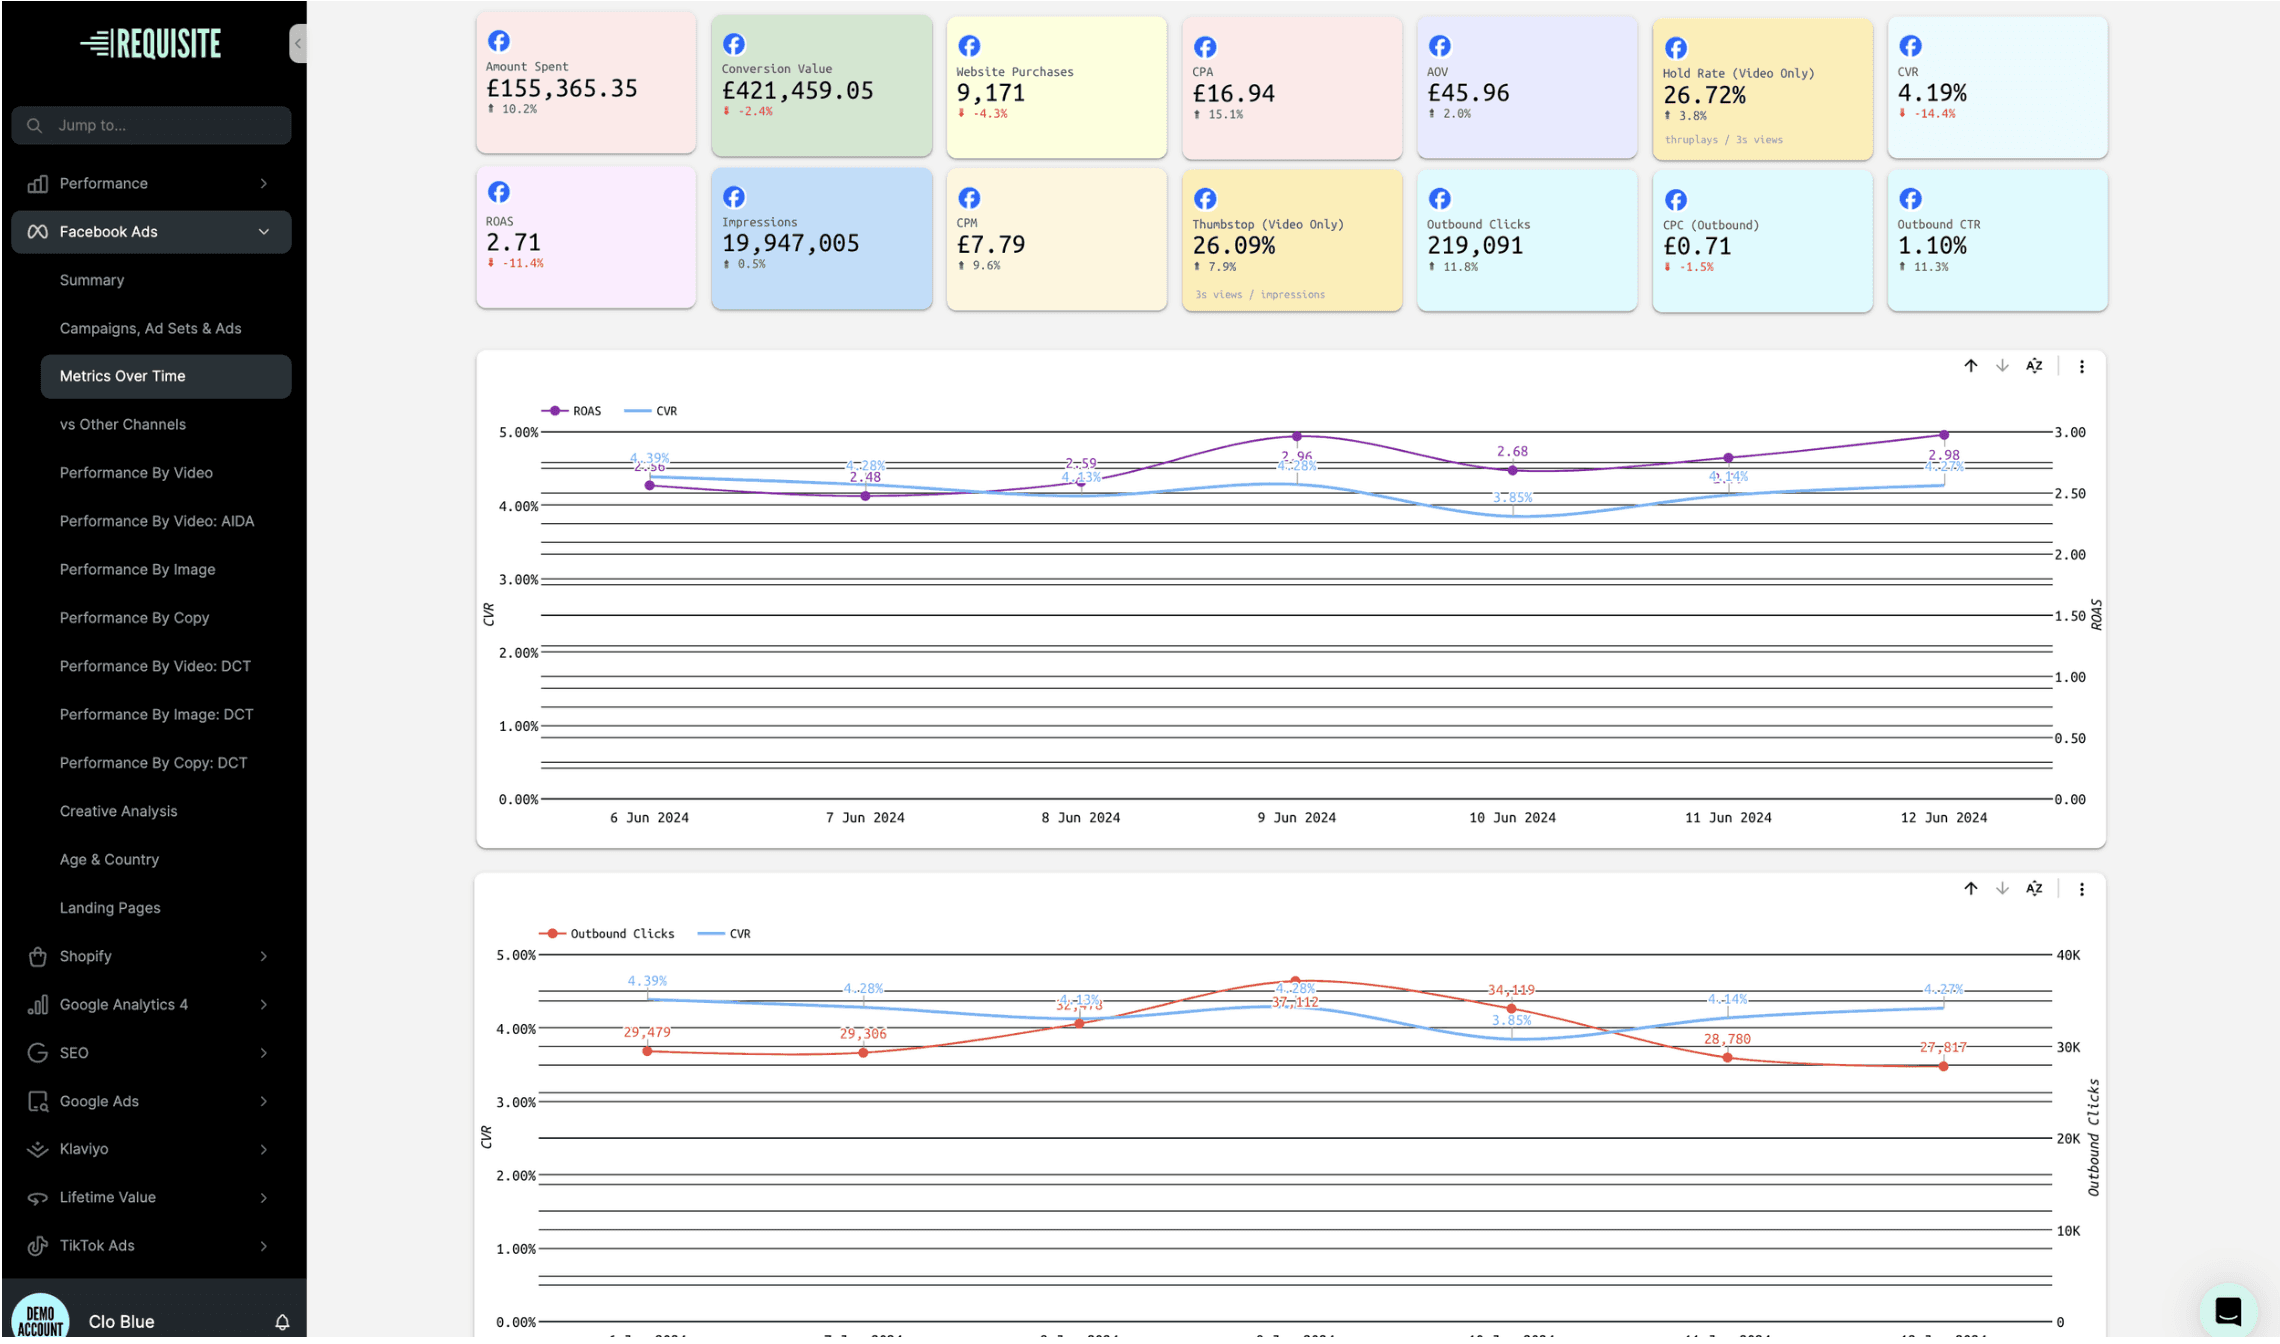
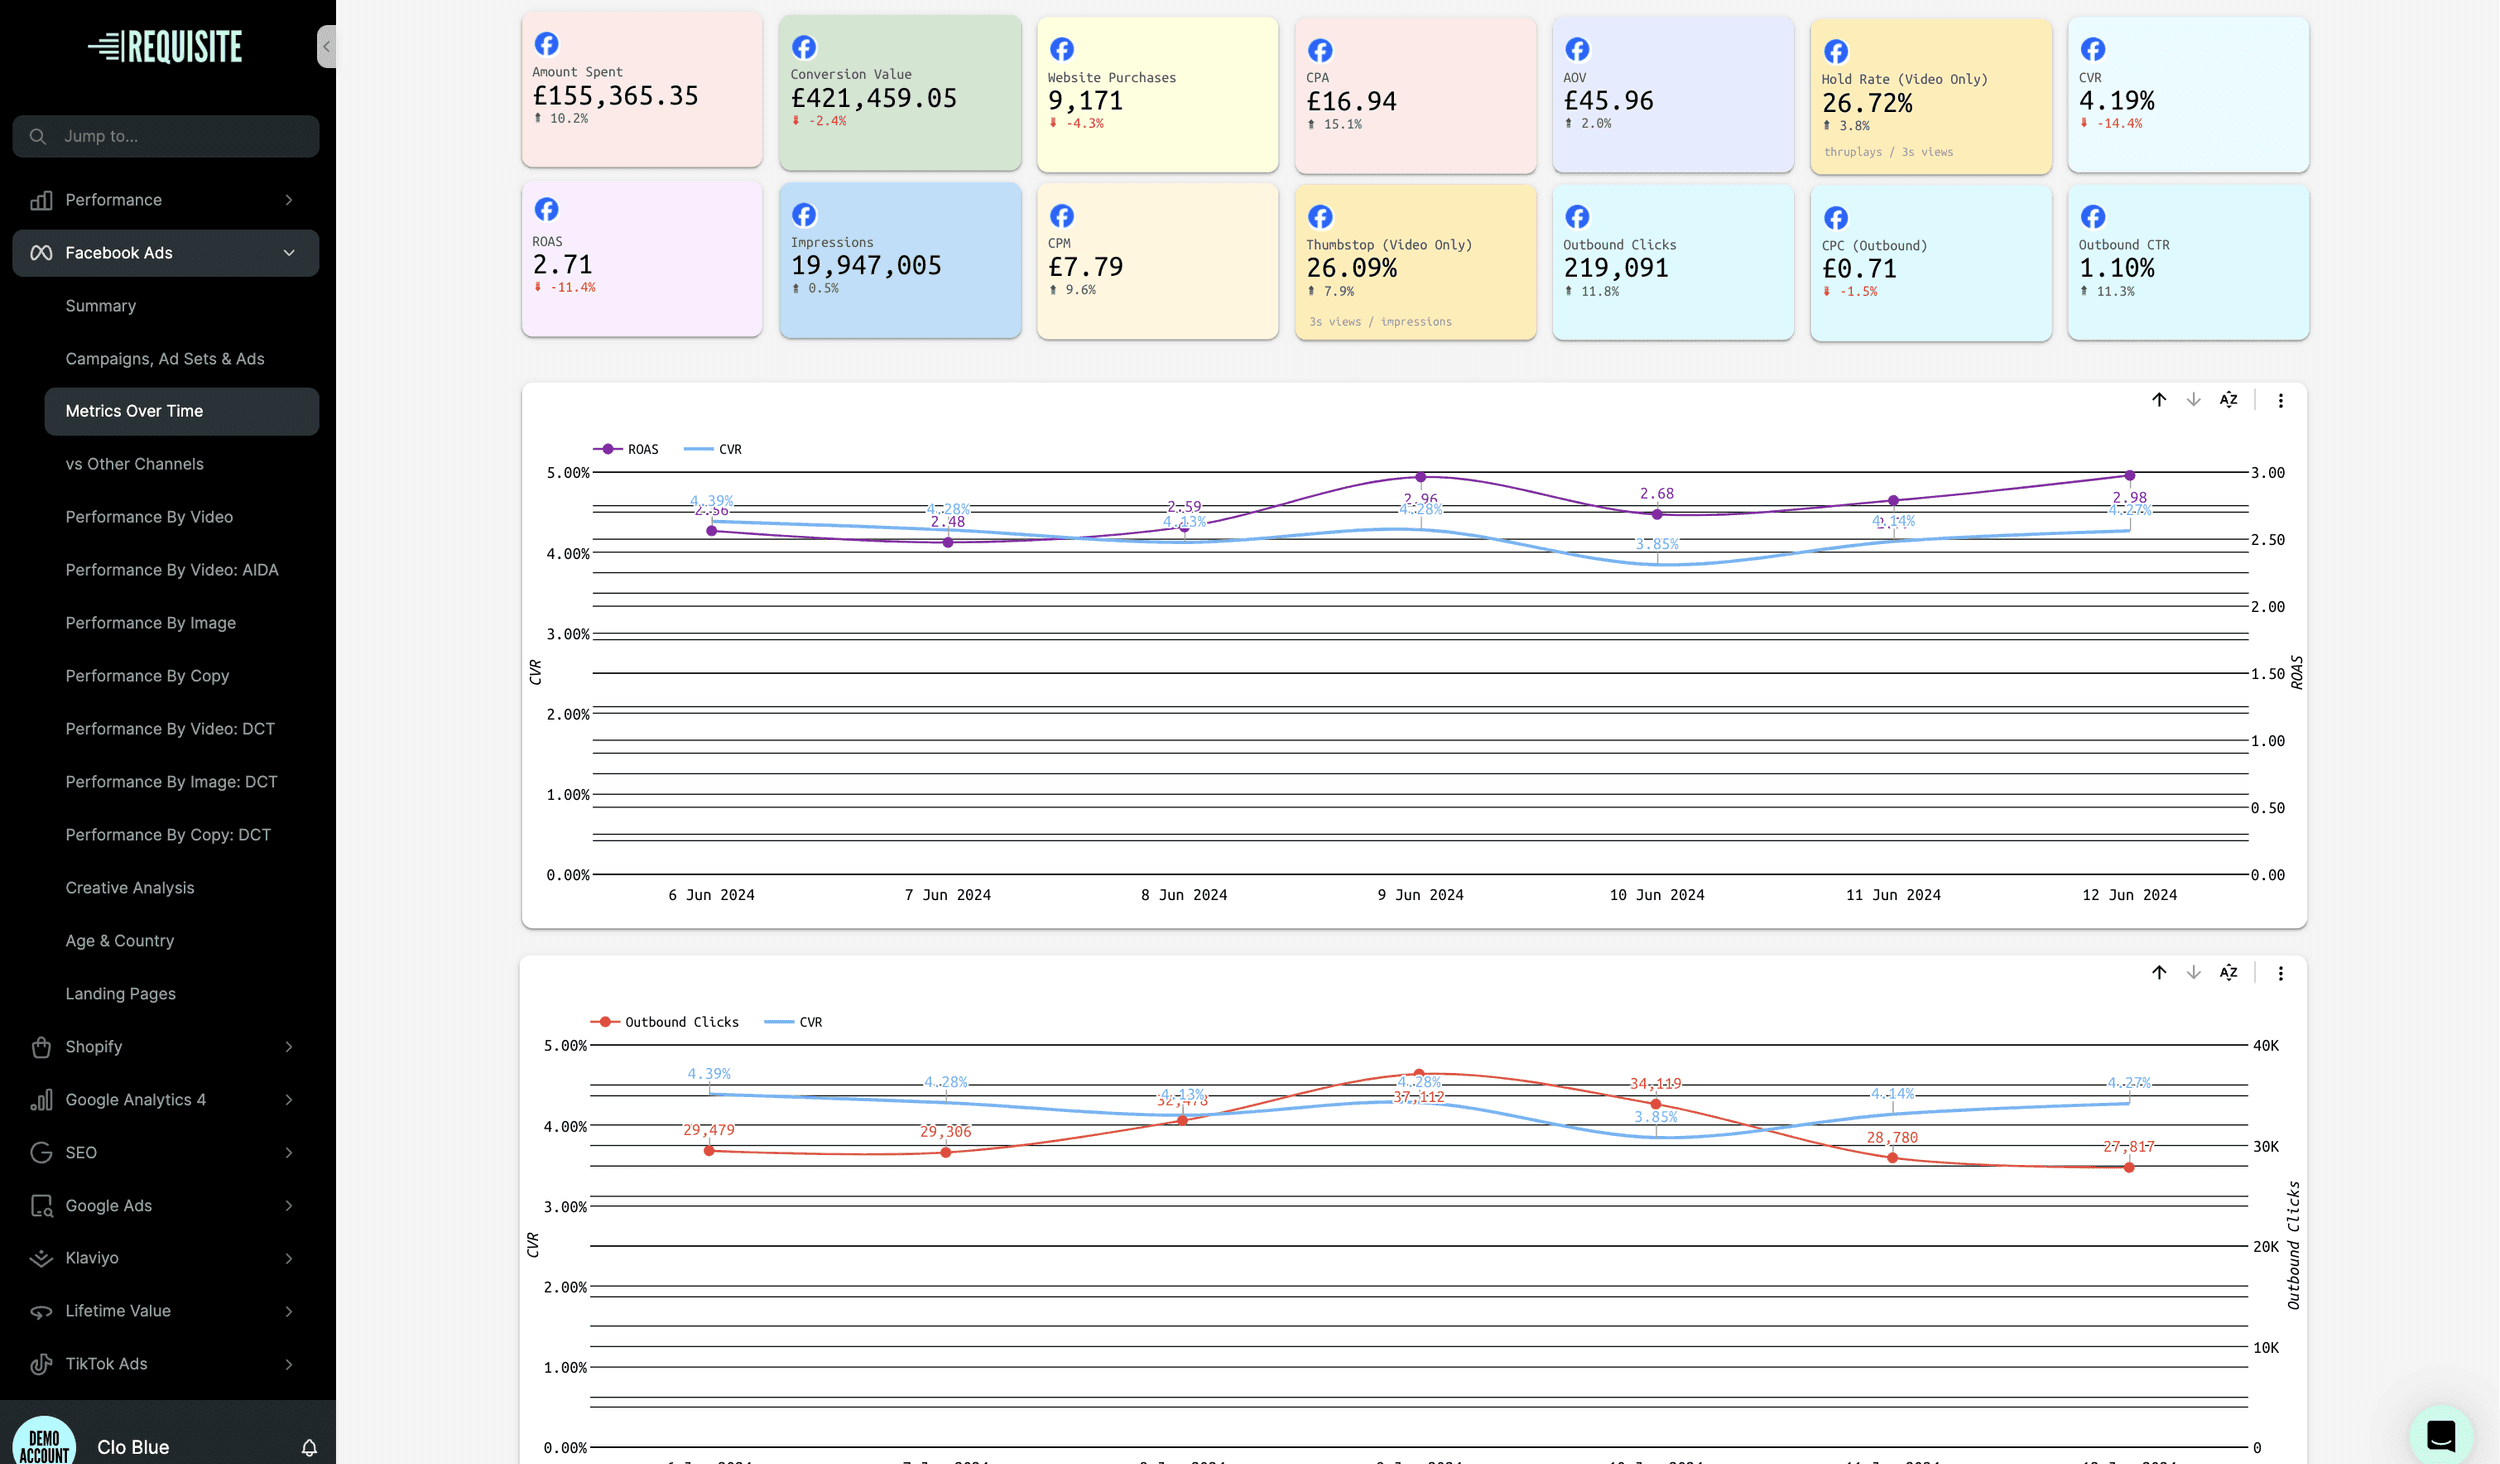
Analysing Facebook Ads Data
Facebook Ads is a powerful tool for reaching targeted audiences. To maximise the effectiveness of Facebook Ads, businesses must analyse several key metrics:
Click-Through Rate (CTR): The percentage of people who click on an ad after seeing it. A high CTR indicates that the ad is engaging and relevant to the target audience.
Cost Per Click (CPC): The amount paid for each click on an ad. Lowering CPC while maintaining a high CTR can improve ROI.
Ad Relevance Diagnostics: Facebook provides three diagnostic metrics: Quality Ranking, Engagement Rate Ranking, and Conversion Rate Ranking. These metrics help businesses understand how their ads compare to competitors and identify areas for improvement.
Audience Insights: Facebook’s Audience Insights tool provides detailed information about the demographics, interests, and behaviours of the target audience. This data is invaluable for refining targeting strategies.
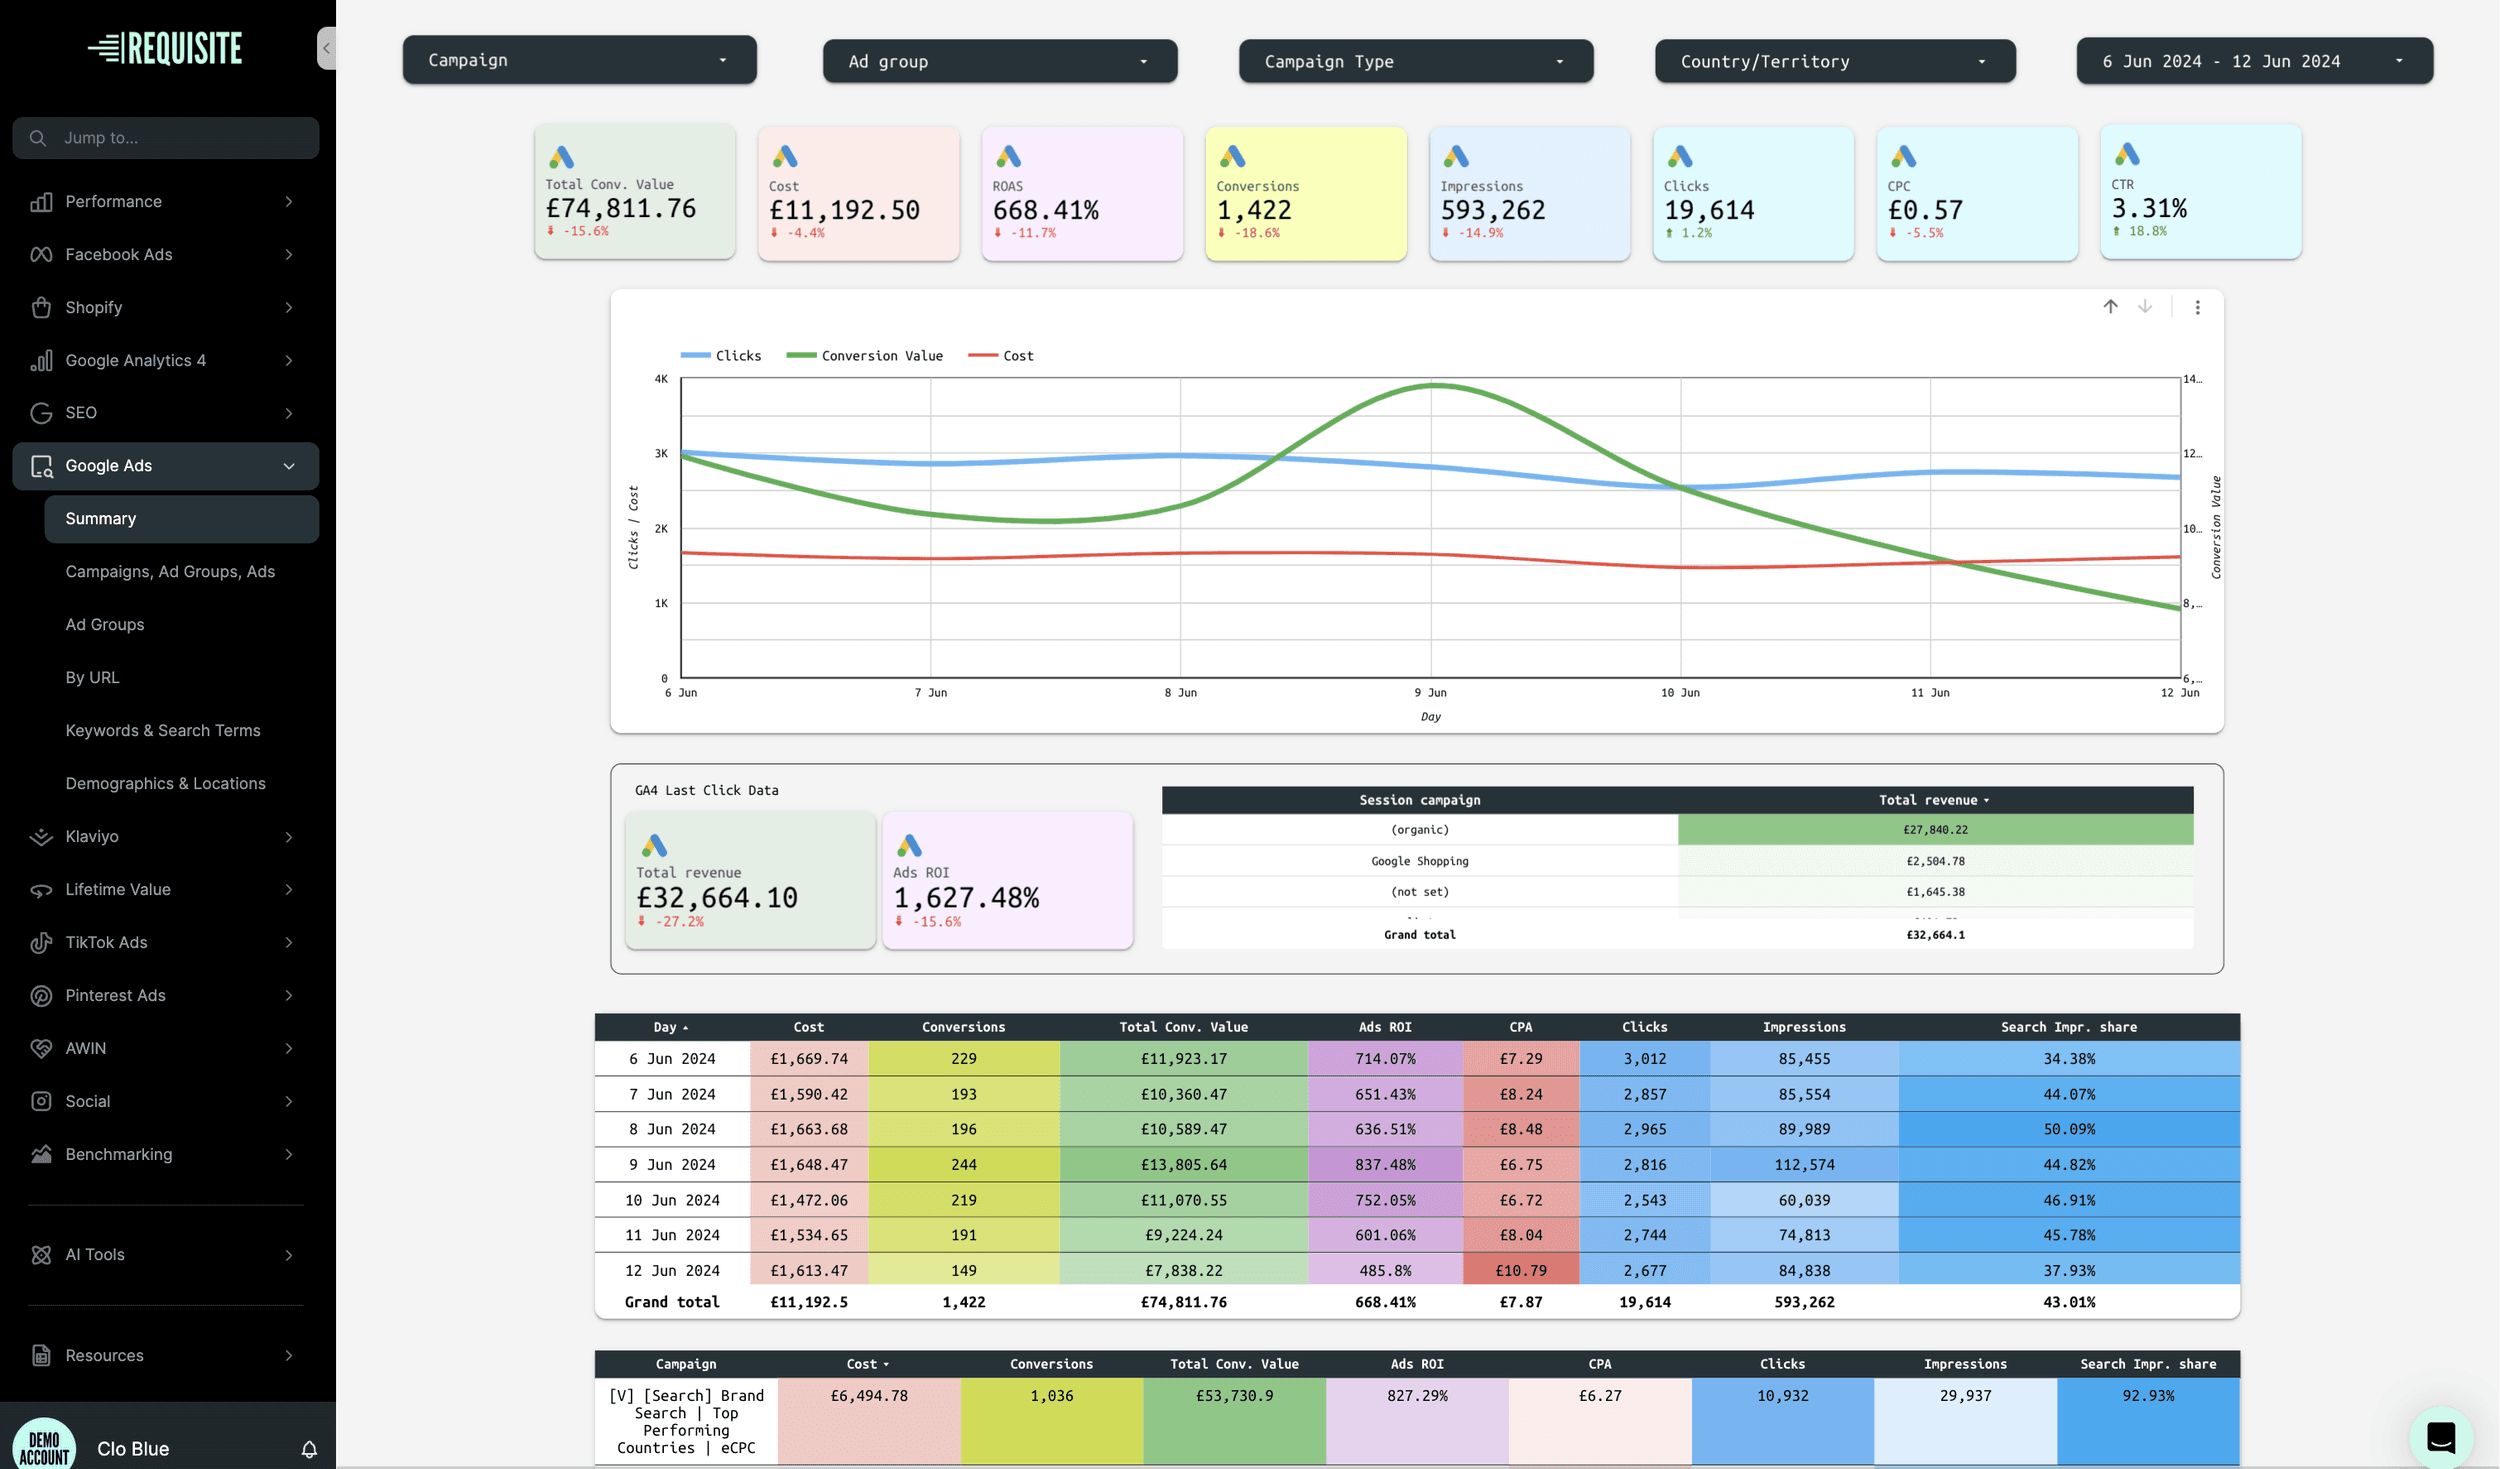
Leveraging Google Ads Data
Google Ads allows businesses to reach potential customers through search, display, and shopping ads. Analysing Google Ads data involves focusing on the following metrics:
Impressions and Impressions Share: The number of times an ad is shown and the percentage of total impressions it receives. High impressions and impression share indicate strong visibility.
Quality Score: A metric that evaluates the relevance and quality of keywords, ads, and landing pages. Improving Quality Score can lower CPC and improve ad positioning.
Search Term Reports: This report shows the actual search queries that triggered ads. Analysing these queries can help identify new keyword opportunities and negative keywords to exclude.
Conversion Tracking: Setting up conversion tracking allows businesses to measure the actions taken by users after clicking on an ad. This data is essential for understanding ad performance and optimising campaigns.
Optimising Shopify Data
Shopify provides a wealth of data on store performance, customer behaviour, and sales. Key metrics to analyse include:
Sales by Traffic Source: Understanding which traffic sources drive the most sales can help allocate marketing resources effectively.
Product Performance: Analysing data on product views, add-to-cart rates, and sales can identify best-selling products and those that need promotion.
Customer Segmentation: Segmenting customers based on behaviour, purchase history, and demographics can help personalise marketing efforts and improve targeting.
Cart Abandonment Rate: The percentage of users who add items to their cart but do not complete the purchase. Reducing cart abandonment through targeted email campaigns and improved checkout processes can significantly boost sales.
———————————————————
Implementing Data Analysis with Requisite Reporting
Requisite Reporting offers a comprehensive solution for eCommerce brands, providing over 100 pre-configured dashboards and 600+ connectors to various data sources. The platform centralises data, allowing businesses to analyse performance across multiple channels in one place. Key features that support data analysis include:
Detailed Reports: Colour-coded reports provide clear insights into key metrics, making it easy to identify trends and areas for improvement.
Custom Views: We customise every page of every report to ensure that relevant data is accessible and actionable.
Quick Setup: Requisite Reporting promises setup within 24 hours, enabling businesses to start analysing data quickly and efficiently.
———————————————————
Practical Steps for Improving Marketing Strategies
With the insights gained from data analysis, businesses can implement several strategies to improve their marketing efforts:
Refine Targeting: Use audience insights from Facebook Ads and Google Ads to refine targeting parameters, ensuring ads reach the most relevant audience.
Optimise Ad Creatives: Analyse the performance of different ad creatives and iterate based on what resonates most with the audience. A/B testing can help identify the most effective designs and messages.
Personalise Marketing Efforts: Leverage customer segmentation data from Shopify to personalise email campaigns, product recommendations, and promotions. Personalisation can significantly improve engagement and conversion rates.
Improve User Experience: Analyse website and checkout data to identify and address pain points in the user experience. Enhancing site speed, navigation, and the checkout process can reduce cart abandonment and increase sales.
Allocate Budget Effectively: Use ROAS and other performance metrics to allocate marketing budgets to the most effective channels and campaigns. Continuously monitor and adjust spending to maximise ROI.
Conclusion
In the rapidly evolving eCommerce landscape, data analysis is a powerful tool that can drive significant improvements in marketing strategies. By leveraging insights from platforms like Facebook Ads, Google Ads, and Shopify, businesses can make informed decisions, optimise marketing efforts, and ultimately enhance their bottom line. Requisite Reporting's comprehensive analytics solutions further empower eCommerce brands to centralise data, generate actionable insights, and implement data-driven strategies effectively. Embracing data analysis is not just a competitive advantage; it is a fundamental aspect of successful eCommerce marketing.
———————————————————

With Requisite Reporting, you can access 100+ pages of your eCommerce data, in an easy-to-digest format. This includes a breakdown of your marketing channels, in more detail than you could imagine.
We integrate with over 600+ channels, providing you with automated reporting, that’s actually accurate.
Article by

Clo Blue
CEO and Founder
Published on
Jun 13, 2024